How can investors tell when a bear market has run its course and a new market cycle is beginning?
The summer rally in equities is firmly behind us. For optimistic investors it proved to be a false dawn, while for the realistic (ourselves included) it offered a good opportunity to rebalance equity weightings in multi-asset portfolios.
Rallies are a common feature of bear markets, and this bear market is no different. At the time of writing (September 2022), we have had four rallies so far in 2022. The most recent, from mid-June to mid-August, saw the MSCI ACWI rise by 13.2% in US$ terms and has now largely reversed. There may be more to come and patience is needed – but how can investors discern when a bear market has truly reached its nadir and is on the cusp of a new upward cycle?
The history of bear markets inevitably offers a limited dataset and the cause of each sell-off is different. Having said that, there is still much to be gleaned from the information available. Russell Napier’s book - ‘Anatomy of the Bear: Lessons from Wall Street’s Four Great Bottoms’- provides a fascinating description of the extreme lows of the great bear markets in 1921, 1932, 1949 and 1982. These lows were accompanied by cheap valuations, low inventories and depressed corporate margins. They tended to occur when a period of inflation turned to deflation and commodity prices stabilised, with copper providing a good lead indicator.
Napier observed that bond prices tend to lead equity prices from the low, and that the market bottomed only when the Federal Reserve (Fed) was reducing interest rates. In each case, corporate earnings continued to fall after the market bottom, and improving economic news was ignored. The impending recovery was not obvious to market participants: commentators worried that a worsening fiscal position would prevent recovery, but this proved to be misplaced. Mirroring the ‘blow-off’ last hurrah seen at the top of bull markets, the low point for stock prices in a bear market typically comes with a final slump.
Armed with abundant data and processing power, modern-day equity strategists are in a slightly better position than their predecessors when it comes to gauging whether a bear market is nearing its trough.
In particular, three handy rules of thumb for assessing bear markets can be found in:
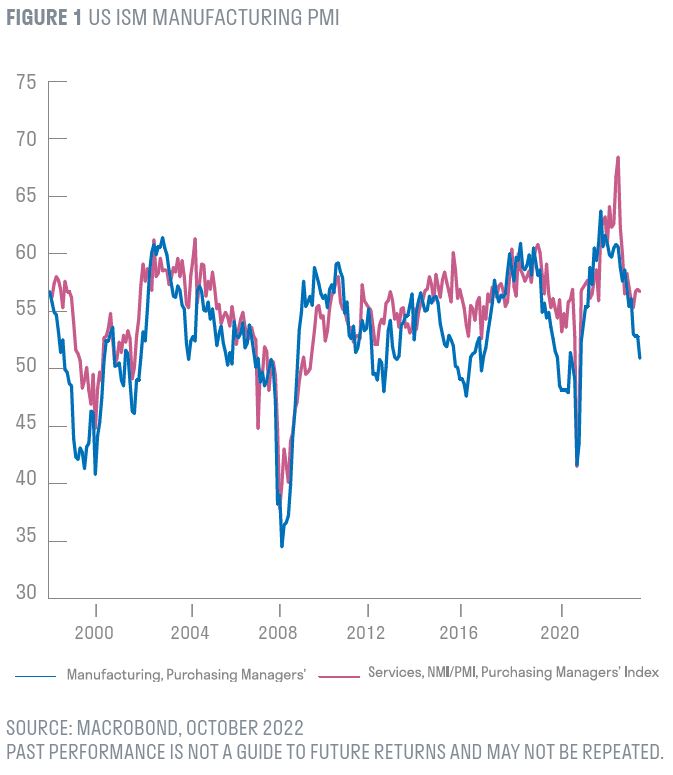
- The level of leading economic indicators, such as the ISM Manufacturing PMI
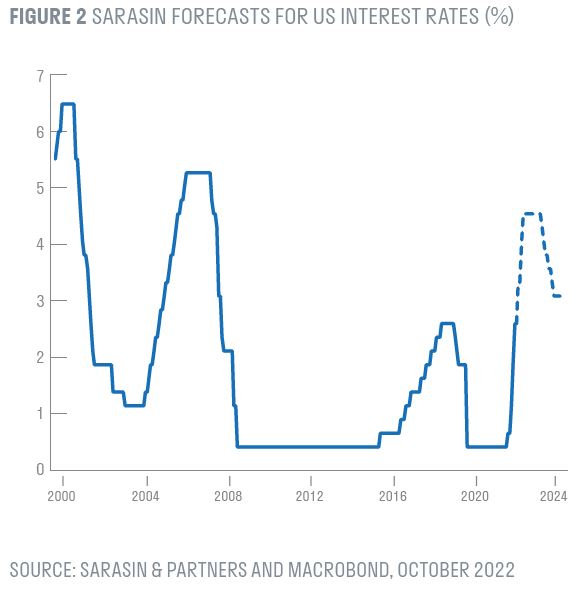
- Changes in the Fed’s monetary policy stance
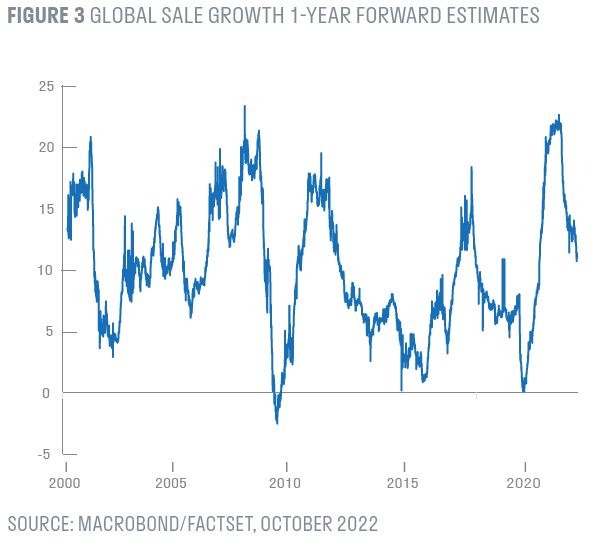
- The rate of decline in earnings expectations
Looking at these in turn, purchasing managers’ indices provide a useful indication of future economic growth via the levels of activity experienced by supply chain managers. A PMI reading above 50 usually indicates growth. In mild recessions PMIs tend to bottom in the high 40s, while hard landings send them to the low 40s.
The September 2022 reading for the US Institute of Supply Management’s Purchasing Managers Indicator Survey was 50.9, within which the new orders component was 47.1. From this, we can reasonably conclude that the US economy is losing momentum but is some way off reaching its low point for this cycle.

Fed watching
The Fed has emphasised its intention to stay the course in fighting inflation. Jerome Powell made this abundantly clear in August at the Jackson Hole Economic Symposium, perhaps in recognition of Paul Volcker’s false step in 1980, when he prematurely reduced interest rates only to be forced to resume raising them for a further 12 months. Persistently strong inflation data released after Jackson Hole has strengthened this view.
Current market pricing implies that US rates will peak in the first quarter of 2023 at c.4.5%, and that US interest rates will be cut in the second half of 2023. It should be remembered, however, that both the Fed and the bond market have proved to be poor forecasters of inflation and policy in this cycle. For the current headline US CPI rate of 8.3% to reach the 2% inflation target by mid-2023, month-on-month inflation would need to slow rapidly from 0.7% to 0.1%. If inflation does not cool, assumptions around the terminal rate could conceivably rise to 5% or higher. For the moment, the best that we can do is to assume that monetary easing is not imminent.

Quantitative tightening (QT), or the removal of liquidity from the economy, is a feature of this market cycle that has not been present in the past and further complicates the outlook. The Fed has laid out a plan to reduce its US$9tn asset portfolio, and as at September 2022 aims to reduce this by US$95bn per month. It is unclear how QT will impact the shape of the US yield curve, the value of the US dollar and therefore the tightness of financial conditions. It is also hard to judge how the Fed might adjust this plan according to circumstances, or how the markets will respond.
Eyes on earnings
Our third tell-tale of having reached a durable bottom in equity markets is a turn in expectations for corporate profits. Specifically, we are looking for a slowing in the rate of decline in earnings expectations, as this tends to presage a return to growing earnings expectations.
Most companies experience a decline in earnings during recessions, but the size of this decline varies significantly, and is only partially dependent on the extent of GDP weakness. The large economic contractions in 1975, 1980 and 1981 coincided with relatively small declines in earnings, whilst the Global Financial Crisis of 2009 caused the worst decline in profits since WWII. By contrast, the recession after the Dotcom Bubble was fairly mild, but the earnings impact was disproportionately large as expectations for technology sectors collapsed. According to Bloomberg, the average earnings per share (EPS) decrease associated with recessions since 1960 is 31%. Excluding 2001 and 2009 gives an average EPS decrease of 17%.
So earnings behave very differently in different bear markets. But one unifying factor is that when the rate of decline in earnings expectations begins to slow, equity markets start to price in an improving outlook, even if the economy is in recession and profits are still falling.
As with PMIs and interest rates, we are far from this stage. Earnings expectations in the US are just beginning to fall, with S&P 500 earnings expectations registering a mere 3% decline since the start of Q3 2022. Current aggregated bottom-up expectations are for US company profits to grow by 9% in 2023 and 7% in 2024. Unless a recession can be avoided, earnings expectations for 2023-4 appear to be as much as 25% too high, even if we are blessed with a soft landing. We may be months away from any slowdown in the rate of change in earnings downgrades.
Today the outlook for earnings is increasingly challenged by slowing global economic momentum, just as liquidity is being withdrawn by central banks. Higher prices, as companies pass on the impacts of inflation, will tend to reduce demand, while labour costs (which tend to lag inflation) are likely to rise in 2023.
Should price inflation moderate in 2023 it will reduce nominal revenue growth just as labour costs rise, squeezing margins and reversing the lift many companies had in 2022, when they benefited from higher nominal growth as prices increased. A similar effect was seen in 1974, when inflation peaked at 12% and earnings subsequently fell dramatically as lagged cost pressures and higher interest rates caught up with them.

As Napier notes, bear markets tend to end with a final slump. A drawdown to a more attractive entry point in equities could happen quickly in the event of investor capitulation. We do not assume that we can time the market bottom precisely and we believe our framework is more useful for risk allocation within a portfolio. We must nonetheless be ready: there would be plentiful thematic companies trading on appealing valuations.
The impending recession could be mild relative to past cycles; this makes market timing difficult, but potentially less important for long-term equity investors. The Fed is determined to bring inflation to heel and this might happen sooner than generally expected if supply chains continue to ease and commodity prices fall.
With this in mind, we have moved to a neutral position in our multi-asset funds’ corporate credit allocations. The recent turmoil in UK bond markets might be evidence that we are entering a classic disorderly period in this bear market that could herald the eventual trough.
Important Information
This document has been issued by Sarasin & Partners LLP which is a limited liability partnership registered in England and Wales with registered number OC329859 and is authorised and regulated by the UK Financial Conduct Authority. It has been prepared solely for information purposes and is not a solicitation, or an offer to buy or sell any security. The information on which the document is based has been obtained from sources that we believe to be reliable, and in good faith, but we have not independently verified such information and we make no representation or warranty, express or implied, as to their accuracy. All expressions of opinion are subject to change without notice.
Please note that the prices of shares and the income from them can fall as well as rise and you may not get back the amount originally invested. This can be as a result of market movements and also of variations in the exchange rates between currencies. Past performance is not a guide to future returns and may not be repeated.
Neither Sarasin & Partners LLP nor any other member of the Bank J. Safra Sarasin group accepts any liability or responsibility whatsoever for any consequential loss of any kind arising out of the use of this document or any part of its contents. The use of this document should not be regarded as a substitute for the exercise by the recipient of his or her own judgment. Sarasin & Partners LLP and/or any person connected with it may act upon or make use of the material referred to herein and/or any of the information upon which it is based, prior to publication of this document. If you are a private investor you should not rely on this document but should contact your professional adviser.
© 2022 Sarasin & Partners LLP – all rights reserved. This document can only be distributed or reproduced with permission from Sarasin & Partners LLP.


