As February began, global equity markets fell abruptly and volatility soared. On the heels of rapid market gains in 2017, investors had been wary of the potential impact of any rise in bond yields, but the sharp backlash when these yield rises materialised was somewhat surprising. Perhaps more noteworthy, though, was the rapid market stabilisation following the dip. Why did all of this happen, and what does it mean for investors?
2017 saw the highest combined flows into equities and bonds since records began (well over £510 billion) dwarfing the previous high by 64%. Importantly, these flows were highly correlated, as equity and bond investors rode a positive wave of synchronised global growth.
But the recent market selloff changed this picture somewhat. Importantly, the selloff was concentrated almost entirely in equity markets, equity-linked instruments and high risk (‘junk’) bonds. Wider bond volatility moved up, but not markedly, and certainly not to unprecedented highs, and similar can be said of currency markets. All in all, there was limited indication of contagion or correlation risk for other asset classes. Why were equity markets so harshly penalised?
There is little doubt that investment funds which specifically target volatility aggravated equity falls, hedging the rising volatility through the direct sales of equities. The prime culprits here were trend-following managers which use futures contracts to achieve their objectives; most use ‘volatility targets’ to manage their risk, adding to their positions when volatility is low, and selling when it rises. Tellingly, these funds accrued more assets in 2017 as market momentum bolstered returns, and held near-record positions in both equities and commodities at the time of the selloff.
But despite these exacerbated declines, equity markets appeared to return to a more stable picture at lightning speed. Why was this?
Are market recovery times shortening?
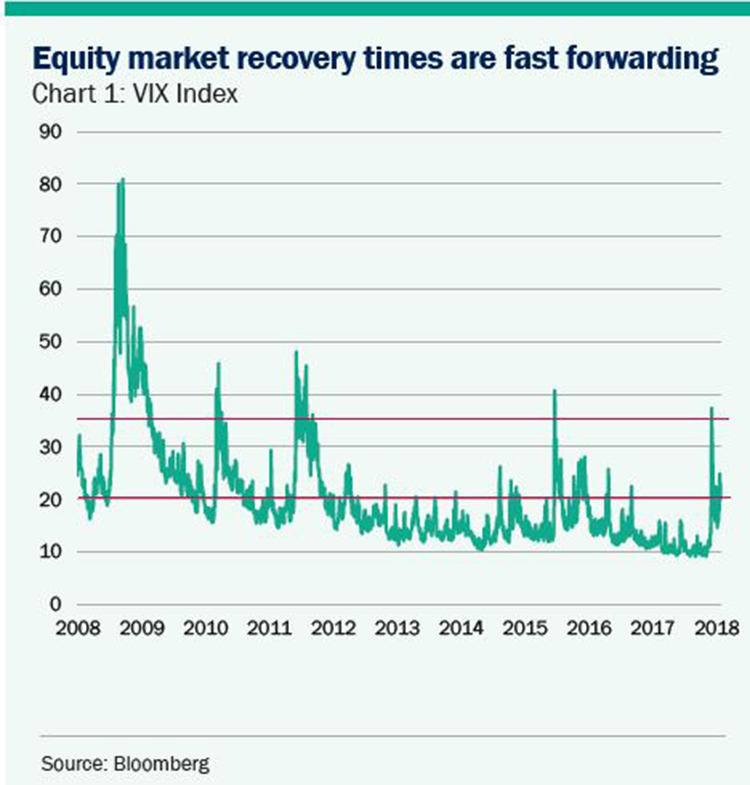
The CBOE Volatility Index (the ‘VIX’) measures stock market expectations of volatility. Historically, when the VIX breaches the key threshold of 35, it has taken in excess of 100 days to stabilise again (returning to a level below 20) - see chart 1. Following the 2008 financial crisis, this timespan more than trebled. However, there are signs that in recent years the pace of normalisation has been picking up; in February, when volatility last spiked above 35, market activity took just nine days to stabilise.

This fast-forwarded impression is supported by equity market pricing too. Let’s consider the S&P 500 (an index based on 500 of the largest US-listed companies), and use an 8% fall in the index as our magic threshold. Since 2008, the S&P 500 has fallen by 8% or more just three times, and on average it has taken barely 4 days for the market to regain at least 5% of this drop. In the decade before this, though, markets generally needed more than 50 days to bounce back from similar troughs. What has changed?
In the push and pull of financial markets, it is difficult to determine the ultimate cause of quicker normalisations in volatility and pricing. It could be that – armed with better technology and greater access to data and analysis – investors are simply able to react and recalibrate more efficiently. It could also be that nimble investors are using market selloffs as buying opportunities, contributing to market volatility on the back of a price fall but ultimately leading to little chaos beyond the immediate aftermath of the dip.
What do investment markets expect next?
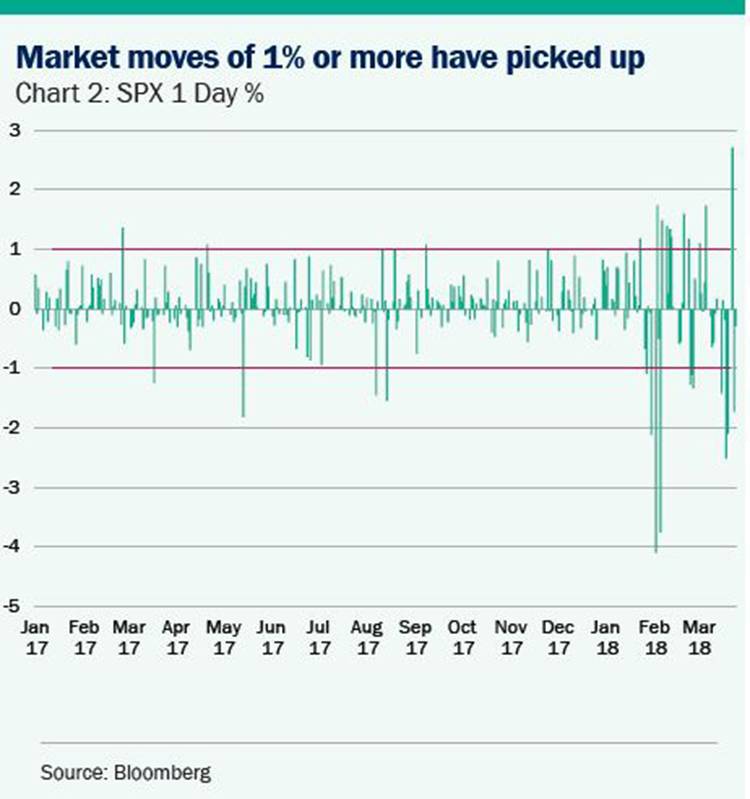
Let’s consider the very recent historical picture. In the whole of 2017, the S&P 500 documented just 10 days of market moves of 1% or more (rising or falling). In stark contrast, 2018 beat this figure in the first two months of the year alone – January and February combined saw 15 days of at least 1% moves, with the weight of this felt in February, where more than half of all trading days experienced rises/falls of this magnitude - see chart 2.

While investment markets (much like investors themselves) can be unpredictable and often obtuse, there are some key indicators to uncover clues about their future expectations. One helpful tool in assessing what markets think will happen next is the ‘options’ market.
Options are intended as a hedge to reduce an investor’s risk – a form of insurance to ensure investments in case of a downturn. If the market is uncertain about the long-term price of an asset, then an option on that asset would generally be more expensive to reflect the riskiness caused by this uncertainty. Fascinatingly, though, in the wake of February’s market turbulence, short-term options contracts (expiring in one or two months’ time) factored in more risk than their longer-term counterparts. What does this tell us about market expectations?
Simply put, it tells us that markets think the long-term picture for investors is clearer than the immediate future. It tells us that markets are sceptical that heightened volatility will be a permanent feature of the investment landscape ahead.
How should investors respond?
It should go without saying that movements in volatility will pose far greater risks to short-term investors than to those taking a long-term approach. Savvy, long-term investors should be able to ride out periods of market turbulence, provided their underlying investments are based on sound investment sense, rather than momentum-chasing optimism.
Nonetheless, we must be mindful that bouts of increased volatility are a potential feature of the ‘new normal’ facing investors today, especially following a period of record low level of volatility. This shifting landscape undoubtedly features potential threats to the high equity valuations and low bond yields investors have grown used to, and managers must prepare robust long-term portfolios which can endure in spite of these challenges.


