Real estate investment trusts (REITs) combine the liquidity of equities with exposure to physical property. After a painful rate shock, improving fundamentals are strengthening the case for recovery.
Key points
Listed real estate offers investors liquid access to a global, diversified property market worth around $2.1trn.
REITs behave like equities in the short term, but track private property more closely over longer periods.
Refinancing pressures are easing, while stabilising asset values and attractive yields support the return outlook.
Commercial property, or real estate, is often favoured by investors looking to diversify portfolios away from traditional equity markets and bonds. For many, talk of the asset class conjures a single building: an office block, a shopping centre, a block of flats, bought directly and held for years. While holding bricks and mortar directly is one way of investing, listed real estate is something different, and in many ways more powerful.
A real estate investment trust (REIT) is a company that owns and operates income-producing property, structured so that investors can access those assets through the stock market rather than through direct ownership. This is typically via a tax-transparent structure that, in exchange for distributing the great majority of rental income to shareholders each year, avoids the layer of corporate tax that direct property funds cannot escape.
A global and sector-diverse asset class
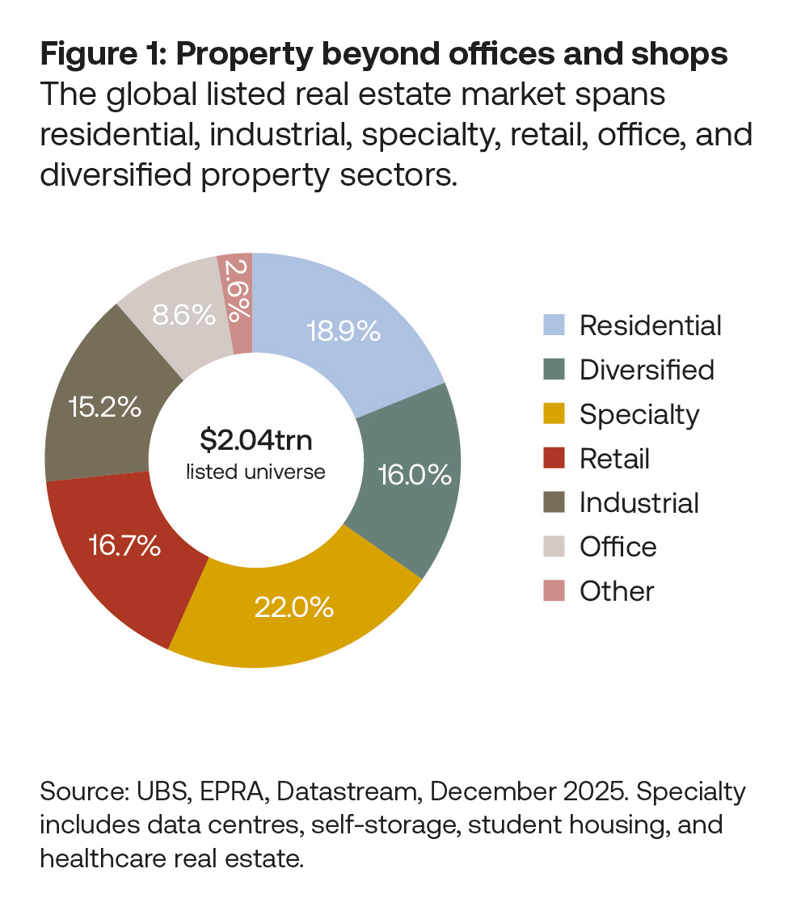
The scale of this universe is easy to underestimate. Across the European Public Real Estate Association’s FTSE EPRA Nareit Global Real Estate Index, the listed real estate opportunity set spans 503 stocks in 40 countries, with a combined market capitalisation of around $2.1trn – 81% of it structured as REITs, the rest as listed property companies. The Americas dominate at 61.2% of global value, with Asia Pacific the second-largest region at 26.7%, and EMEA smaller still at 12.1%.
Perhaps more striking than the geographic spread is the sector spread. Retail and offices – the sectors most people associate with real estate – together make up only around a quarter of the global listed universe by value. The rest is spread across residential, diversified portfolios, industrial and logistics, and a fast-growing “specialty” bucket that includes data centres, self-storage, student housing, and healthcare real estate. Some of the perceived highest-quality assets in the world – flagship logistics parks, hyperscale data centres – are simply not for sale in the direct market; they can only be accessed by owning the listed company that holds them.
Are REITs equity, or are they real estate?
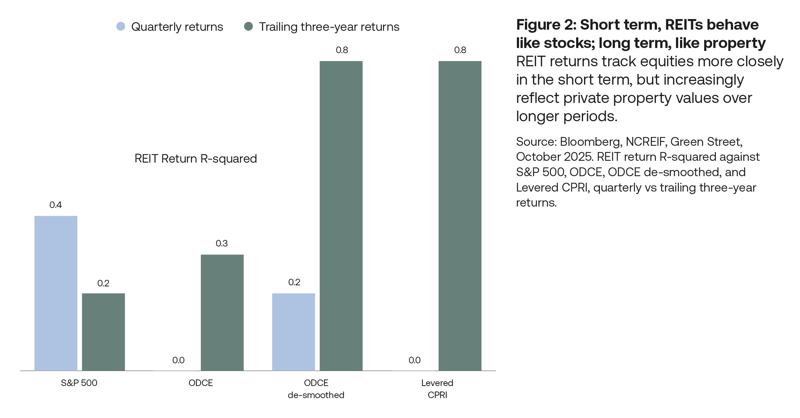
Ask a REIT analyst and an appraiser the same question – “is this a stock or a building?” – and both will answer confidently, but differently. Legally, a REIT is unambiguously an equity: priced every second the market is open, sitting inside benchmark equity indices, tradeable in seconds. None of that is true of a warehouse or a shopping centre. On that basis, sceptics have long argued that REITs belong in an equity allocation, not a real estate one.
Research from Green Street settles the question by horizon. R² is a measure of how closely an investment’s performance moves in line with its benchmark, expressed as a percentage. Measured quarterly, REITs show a high R² against the S&P 500 (0.4) and almost none against private property values (0.0), as per the NFI Open-End Diversified Core Equity (ODCE) Index. However, stretch the horizon to three years and it flips: correlation with the S&P 500 falls to 0.2, while correlation with private property (once its lagging, appraisal-based pricing is corrected for) climbs to 0.8–0.9. Judged over the short run, a REIT looks like a stock; judged over the run that matters to most investors, it looks like a building.
Why the last three years were so painful
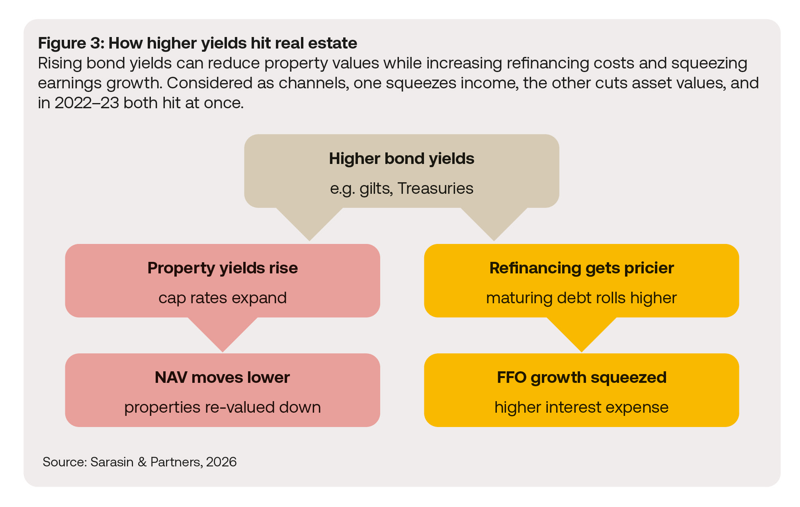
That equity/property duality explains the sector’s most difficult recent stretch. REITs are structurally rate-sensitive through two separate channels, and both bit hard as long-term bond yields rose sharply between 2021 and 2023 – driven not by central bank policy rates directly, but by a surge in inflation that pushed up the long end of the yield curve.
The first channel is leverage: as debt matures, it refinances at the prevailing rate, and a sharp rise in benchmark yields means each refinanced tranche lands at a materially higher coupon – a direct hit to interest expense before any rental growth reaches the bottom line.
The second channel is valuation: commercial property is priced, in essence, as a multiple of its rental income, and as government bond yields rise, property yields tend to follow, since real estate must keep offering a credible premium over the “risk-free” rate. A higher property yield applied to the same rental income produces a lower net asset value, regardless of how well the building is performing operationally.
Both channels ran together through the sharpest years of that bond yield sell-off, from 2021 to 2023, and the resulting de-rating was severe. What makes that period unusual is that fundamentals mostly held up throughout it: occupancy stayed high across most major sectors, and rental growth – often explicitly inflation-linked – remained strong.
This was a cost-of-capital problem, not a demand problem. Yet even after two decent recovery years in 2024 and 2025, listed real estate share prices remain stuck close to where they stood at the depth of that shock in early 2023. This is with the sector still trading close to a 30% discount to net asset value, a historical extreme, and valuation multiples running roughly 18% below their 15-year average.
Since 2023, the picture has changed. Long-term bond yields have stayed high, with periodic bouts of volatility, but have not risen materially further, and 2024 and 2025 proved decent years for the sector as a result, with 2026 continuing that improvement. Companies across the sector have now refinanced a large share of the debt that matures through the cycle, meaning much of the pain of rolling onto higher rates has already been taken rather than still lying ahead.
Our estimates suggest that sector-wide interest costs are still expected to climb further, from around 2.4% today towards roughly 3.4% by the end of the decade, as legacy low-rate debt continues to roll onto today’s higher, but now broadly stable, rate level.
The sharp, front-loaded shock of 2021–23 is behind the sector. NAVs, after three consecutive years of decline through that shock, have stabilised since and, in a growing number of cases, begun to tick higher again.
The outlook is higher-for-longer
The question now is whether that improving picture finally closes the gap between fundamentals and share prices, or whether the gap simply persists. Our view is not that markets are due a sharp re-rating, but rather that the sector no longer needs one to deliver an attractive return.
The case rests on income and growth alone. Funds From Operations (FFO) is a key profitability metric used for REITs. Listed real estate today offers an implied FFO yield of a little over 7%, the highest level since 2013 – a reflection of how far valuations fell rather than any deterioration in income. On top of that sits growth: net recurring earnings are projected to grow at a modest 2.5% a year to 2028 (modest specifically because interest expense is still climbing, taking a bite out of roughly 5% gross rental growth), while NAVs are projected to compound at around 5% a year as property yields gradually ease back.
Put together, a starting yield of around 7%, FFO growth of around 2.5%, and NAV growth of around 5% builds to an implied total return in the region of 14–15% a year – constructed entirely from income and growth, before any credit is given for the sector’s roughly 30% NAV discount narrowing at all. Should that discount close even partially as the market re-rates improving fundamentals, the return path improves further still.
The return case’s resilience is the more important part of the story. The sector’s equity-market beta hasn’t disappeared – a renewed shock to bond yields, or a further escalation of the US–Iran conflict, could still see more leveraged names sell off in sympathy with broader risk sentiment. But with balance sheets repaired and the sharpest repricing already behind it, the sector is far better placed to absorb that kind of shock than it was three years ago. The outlook here is genuinely constructive: a gradual drift towards better fundamentals and a narrowing discount, doing the work quietly from here.
Important information
This document is intended for retail investors and/or private clients. You should not act or rely on any information contained in this document without seeking advice from a professional adviser.
This is a marketing communication. Issued by Sarasin & Partners LLP, 50 George Street, London, W1U 7DY. Registered in England and Wales, No. OC329859. Authorised and regulated by the Financial Conduct Authority (FRN: 475111). Website: www.sarasinandpartners.com. Tel: +44 (0)207038 7000. Telephone calls may be recorded or monitored in accordance with applicable laws.
This document has been produced for marketing and informational purposes only. It is not a solicitation or an offer to buy or sell any security. The information on which the material is based has been obtained in good faith, from sources that we believe to be reliable, but we have not independently verified such information and we make no representation or warranty, express or implied, as to its accuracy. All expressions of opinion are subject to change without notice. This document should not be relied on for accounting, legal or tax advice, or investment recommendations. Reliance should not be placed on the views and information in this material when taking individual investment and/or strategic decisions.
Capital at risk. The value of investments and any income derived from them can fall as well as rise and investors may not get back the amount originally invested. If investing in foreign currencies, the return in the investor’s reference currency may increase or decrease as a result of currency fluctuations. Past performance is not a reliable indicator of future results and may not be repeated. Forecasts are not a reliable indicator of future performance.
Neither Sarasin & Partners LLP nor any other member of the J. Safra Sarasin Holding Ltd group accepts any liability or responsibility whatsoever for any consequential loss of any kind arising out of the use of this document or any part of its contents. The use of this document should not be regarded as a substitute for the exercise by the recipient of their own judgement. Sarasin & Partners LLP and/or any person connected with it may act upon or make use of the material referred to herein and/or any of the information upon which it is based, prior to publication of this document.
Where the data in this document comes partially from third-party sources the accuracy, completeness or correctness of the information contained in this publication is not guaranteed, and third-party data is provided without any warranties of any kind. Sarasin & Partners LLP shall have no liability in connection with third-party data.
© 2026 Sarasin & Partners LLP. All rights reserved. This document is subject to copyright and can only be reproduced or distributed with permission from Sarasin & Partners LLP. Any unauthorised use is strictly prohibited.